Amazon’s introduction of the low inventory fee in 2024 is one of the more unusual fees released in the past few years by Amazon. Why? It is a fee that impacts you as a potential expense but also impacts your cash flow by forcing you to buy, stock, and maintain more inventory. A normal FBA fee is also evenly increased across all sellers. This fee is, however, controllable — albeit difficult. After countless hours of analysis and math (and bringing out the trigonometry and calculus books), I have summarized the ideal number of units to stock distilled into a calculator!
This fee will be implemented on April 1st, 2024, and will only apply to standard-size products.
How is the fee applied?
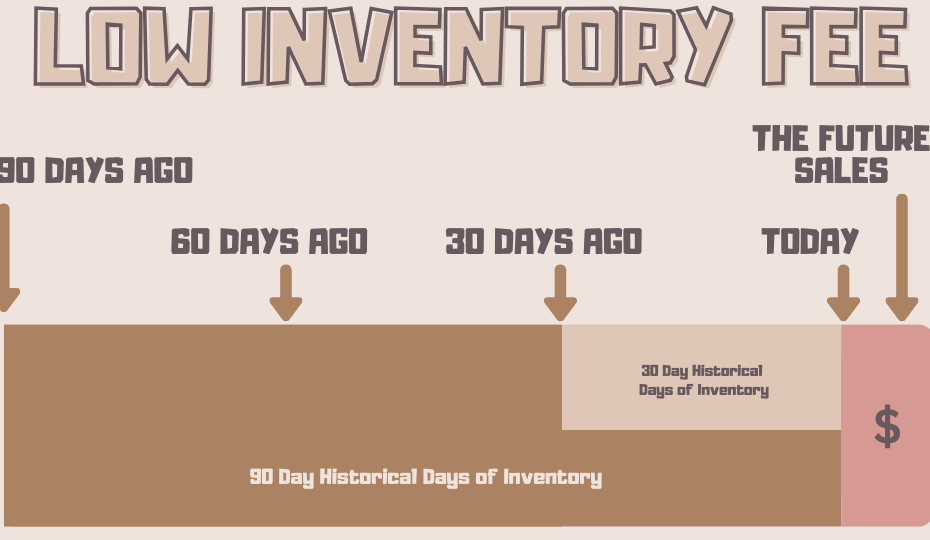
The first misunderstanding I have commonly seen is where and when the fee applies. Your 30-day and 90-day historical days of inventory are the basis as to how this is applied — more on those shortly.
The Low Inventory Fee is, when incurred, applied to future orders (until you stock up again or sell out), based on historical stock levels. Every order After the recalculation (Sunday Night/Monday Morning), will get hit with the fee if that calculation does not pass the 30-Day, 90-Day, and New ASIN test. You will be stuck with this fee for 7 days because, at this time, Amazon does not calculate these metrics daily.
Major Note: The fee never applies retroactively (like traditional storage fees do looking at the past month). It uses historical data to determine if future sales get charged. You also cannot get charged this fee when you don’t have any stock because there are no sales tied to that particular ASIN.
Major Note #2: This calculation is done at the Parent ASIN level. Given this information, some great nuances can be used for or against you. More on this later.
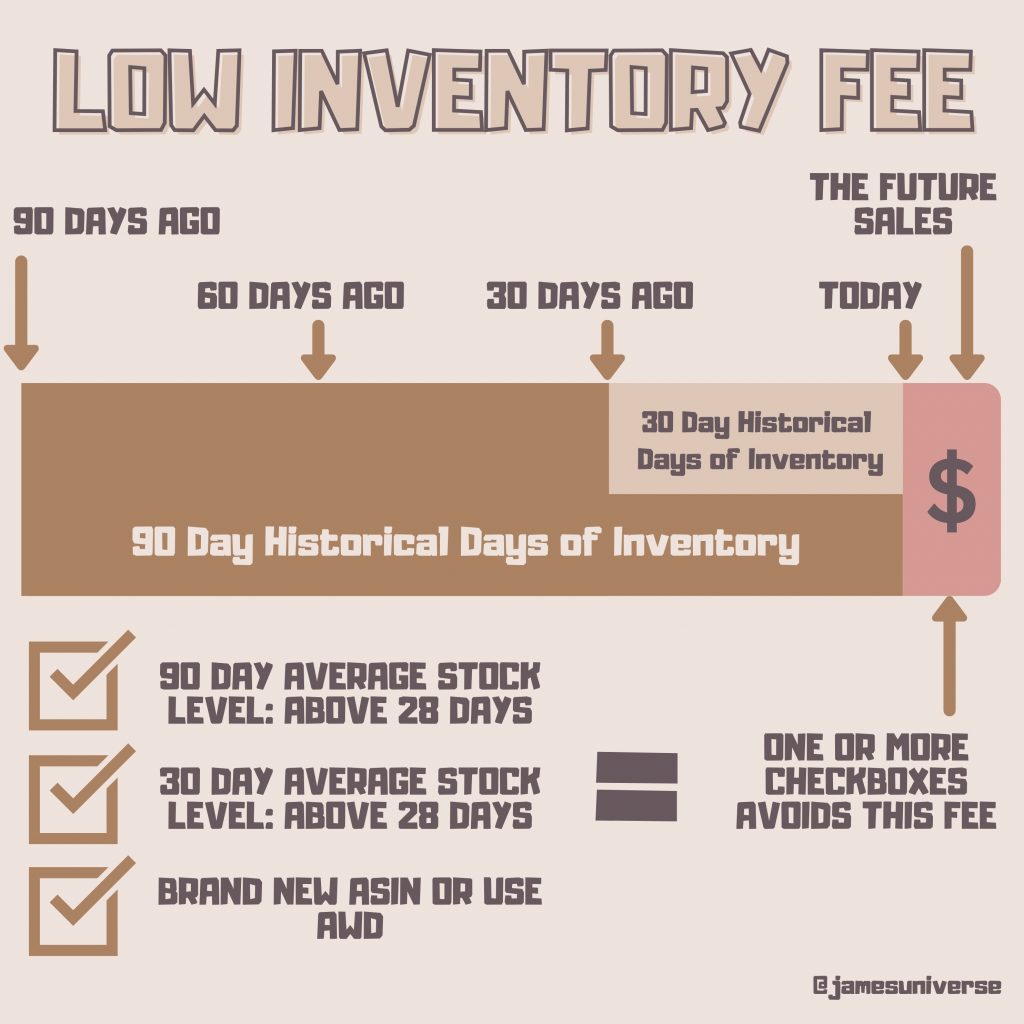
The 3 Tests
New Seller/ASIN/AWD: The easiest to understand, but not the most applicable for most products. If you are a New Seller (<365 days), you are exempt from the fee. If you create a new ASIN, your product falls under the New Selection program that offers a grace period of 180 Days. Additionally, if you drip feed in inventory from AWD (Amazon Warehouse and Distribution), you won’t incur the fee, but will likely be paying more due to AWD Inbound and Transfer costs. AWD Analysis to come in a future article.
30-Day (Historical days of supply) Rule: This is where the math starts to get fun.
1. Every week, Amazon will calculate your past Available, Reserved (Excluding Customer Orders/Unsellable Inventory), and FC Transfer units and calculate your average stock level for that week. Critical Note: This does not include inbound units so the inventory must be checked in. (More on this later)
2. Additionally, they will also calculate the number of units sold that week.
90-Day (Historical days of supply) Rule: The same as above, but over 90 days so it gives some more flexibility for volatile velocity events.
The Data
Amazon provides you with the greater of 30 or 90 Day Historical days of supply metric on the Manage FBA Inventory page of Seller Central. Be sure to activate this column in preferences if you don’t see it. The search on this page is not very consistent. So you may have to search by ASIN. We have also seen very inconsistent results with the “Minimum [Stock] level” amount told by Amazon; Sometimes Great, but sometimes terrible — so don’t blindly rely on it.
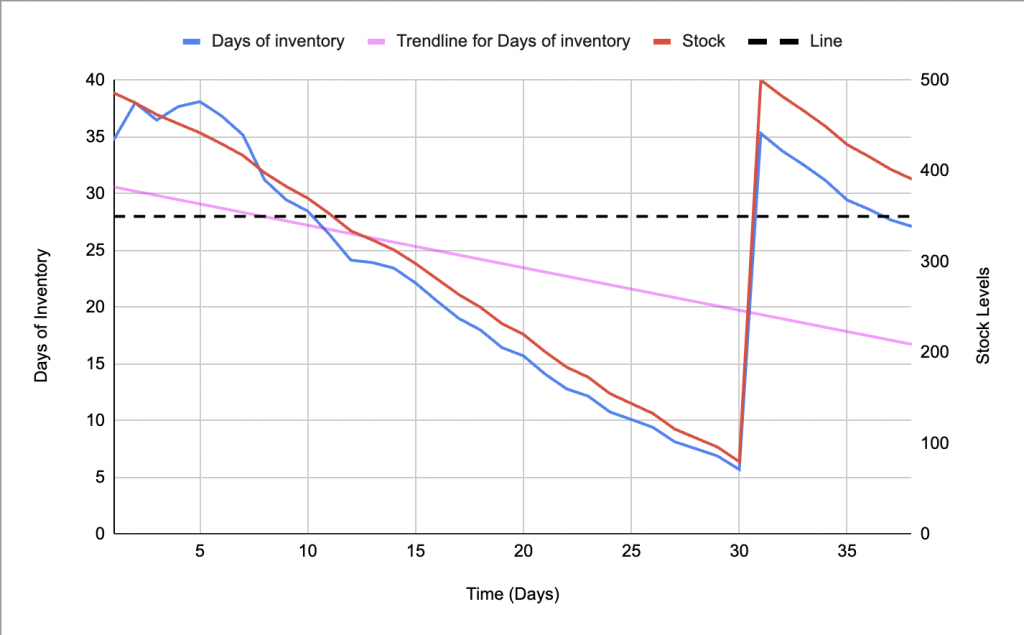
These next charts are approximations as to how a normal restock cycle impacts your likiness to pay the Low Inventory Fee. Treat the Pink Line as an approximation to what a rolling historical days of supply would be like. While your stock (Blue Line) can dip below 28 days of stock temporarily, if the Pink line dips below, you potentially open yourself to the Low Inventory Fees (Factoring in the 90-day average though).
In summary, this means, that if you keep lean inventory like in Example 1 where you have product check-in at the FC (Not just shipped from your facility or picked up by the carrier) at 5 days of inventory remaining, and stock up to about 40 days of inventory, you will be below the 28-day threshold for the Low Inventory Fee (Indicated by the pink trendline).
Example 1: Here you have product check-in (Not ship) at 5 days of inventory remaining (Day 31), and stock up to about 40 days of inventory, you will be below the 28-day threshold (Dashed Line) for the Low Inventory Fee (Indicated by the pink trendline). This means you sent in about 35 days of inventory and have *at Amazon* about 40-45 due to customer orders. This is no longer enough. You could technically stay in stock 100% of the time, yet be incurring massive fees.
Example 2: Here you have product check-in (Not ship) when you reach 31 days of inventory remaining and stock up to about 65 days of inventory, you will be keeping the Historical Days of Stock (Pink Line) above the 28-day threshold for the Low Inventory Fee (Indicated by the pink trendline). This means you restocked in the same amount of inventory, but you hold much more at amazon. Now you need to afford to never dip below that 28-day mark for a sustained period of time.
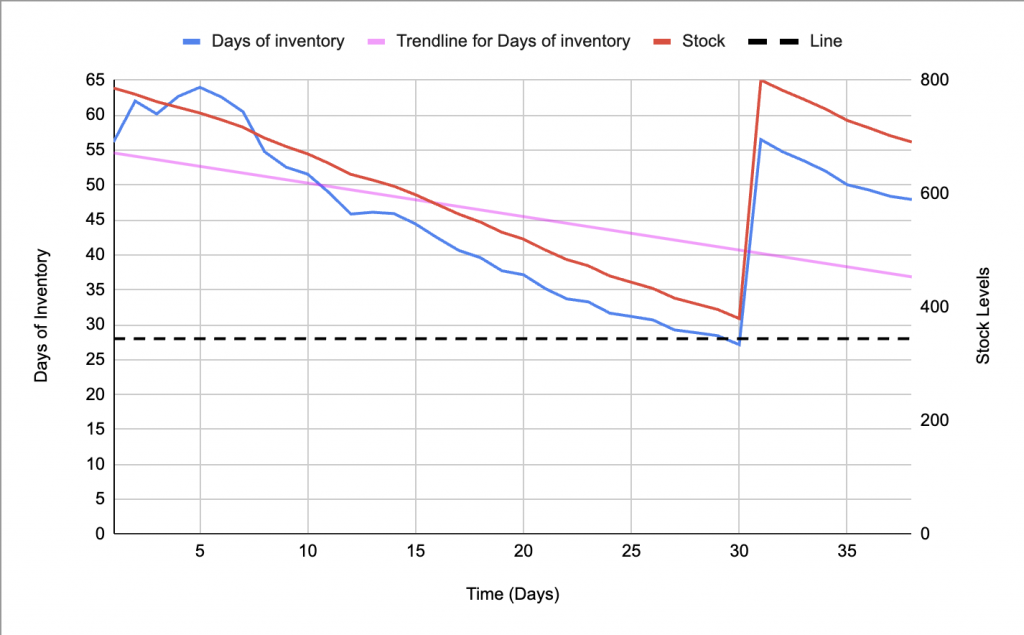
Now yes, the 90-day calculation helps provide a buffer and the above graphs don’t perfectly demonstrate a rolling Historical Days of Stock, but these are intended to just provide broad visuals. This doesn’t mean you can’t dip below 28 days of stock, but you have to be above that threshold a majority of the time.
The 5 Conundrums
- The IPI Score is WRONG: The IPI Score says you need <2 weeks of inventory for an “ideal” sell-through and penalizes you for every week over that. Yet this new fee penalizes you for dipping below 4 weeks? Why did Amazon build 2 functions for inventory management that contradict each other? If I knew the answer to “Why Amazon…” I think I’d be in a new business model.
- 7-Day Curveball: Wouldn’t it be handy if this data was provided in real-time‽ Well, of course! That’s why Amazon only calculates this every 7-days. Amazon would never make things easy! So even if you are 1 day off, you have to wait until the following Monday for the calculations to reset.
- New and Seasonal Products: Wouldn’t this severely hurt sellers with short “sell periods” (Such as Valentines or Graduation)? Or how do you launch a new product when the sell-through is completely unknown?
- Parent ASINs: You can do the math, and forecast well, but maybe your best product has a production delay. Now your entire selection across all variations in that parent gets nailed with your fee potentially. Ouch!
- Stock too little? Pay a fee; Stock too much? Pay a fee: Where is the balance‽ This question is what puzzled me the most and is the basis of writing this article. Running too low gets hit with a per unit fee while running too much gets hit with a per cubic foot fee. This means for every product size, there is a perfect optimal range to stock inventory. Let’s call this “Optimal Inventory Theory”.
Optimal Inventory Theory
Using the derivative of an exponential graph, we can mathematically approximate for the optimal range and maximum level of stock where you incur the lowest storage fees and still avoid the Low Inventory Fee. But don’t worry. I did the math for you. Now let’s learn how to use it.
Of course, the optimal amount of stock is 29 days of inventory and you’d send in exactly one day’s sales of inventory every day. We all know this is both impossible and unrealistic. So let’s dive into that “upper bound”.
Important Note: Everyone has different supply chains. All the information below is based on when inventory checks in — not ships or gets made. So you need to add your seller/brand-specific lead times to the numbers.
Example 3: It’s hard to see how impactful that low inventory fee hits until plotted. The chart below is for an example product outside of Q4 times. The upper bound in which storage fees exceed the Low Inventory fee is 54 Days. (54 days is approximately the same total-incurred-fee as paying the first Low Inventory Fee tier) So for this product, you’d ideally stay in that range of 29-54 days at Amazon at all times. The reason the chart increases in cost over time is the accrued storage fees add up over time per unit. Our goal is to find the balance between the storage and the Low Inventory Fee.
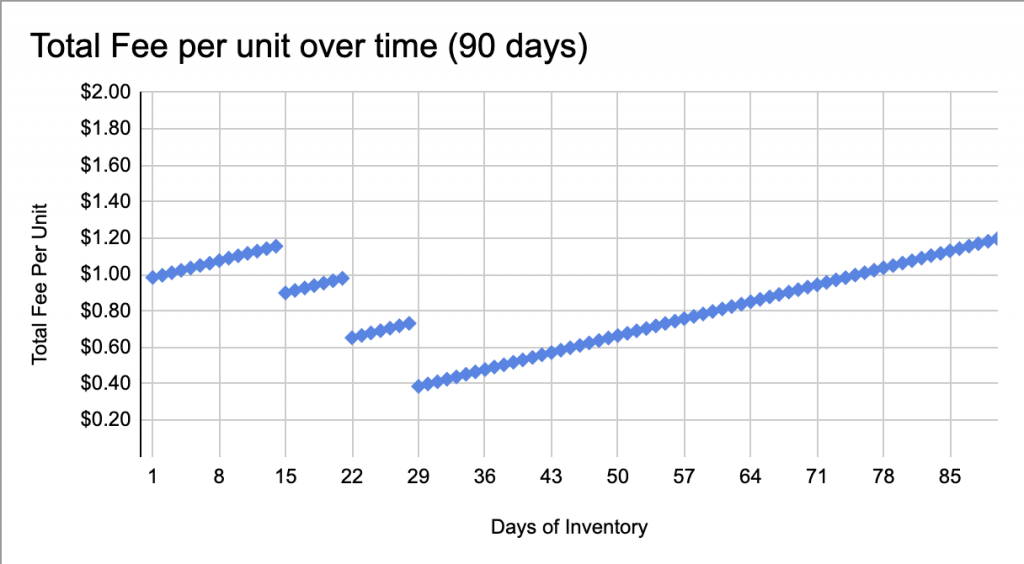
Example 4: However for a smaller product, you can see you can stock 179 days of inventory and still be cheaper than paying a low inventory fee. (Yes those long-term storage fees are intense too!). This means for some products, it is disproportionally better to overstock than understock. Additionally, you don’t need to stock 179 days of inventory.
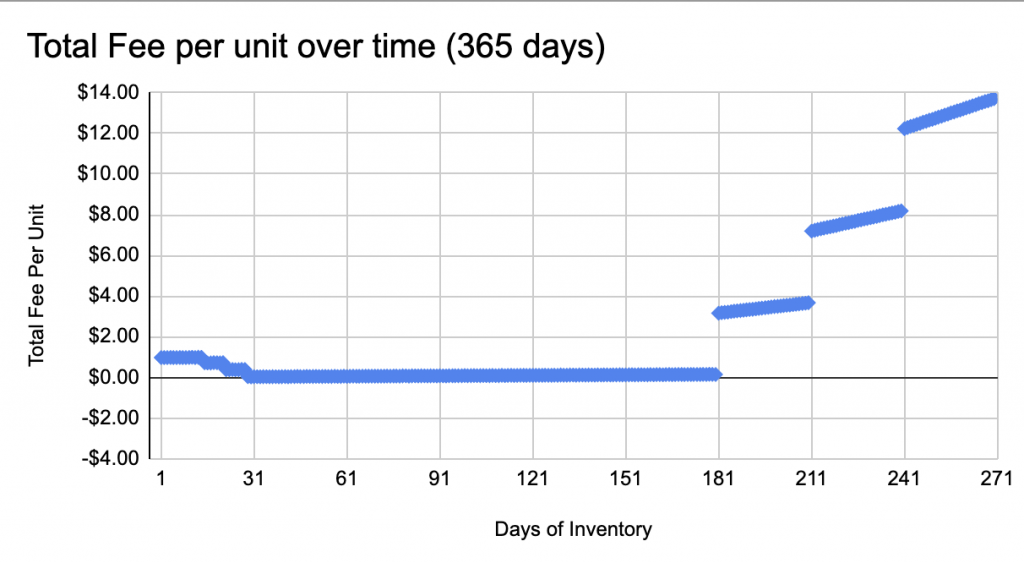
Important Note: If, for a given product size, your “ideal” range is large, then you can potentially save money by stocking less than the maximum stock for that range. But be careful. Smaller ranges have much less room for error.
Q4 Changes Everything!
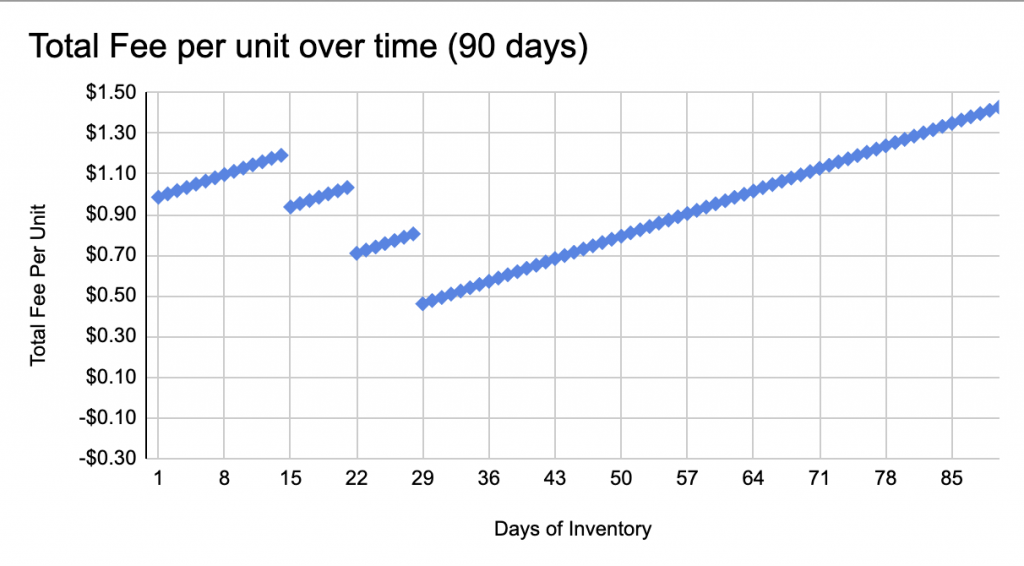
Example 5a: (Before Q4) Lastly, Q4 changes everything. That Q4 storage fee spike can make a product go from an ideal 29-90-day range…
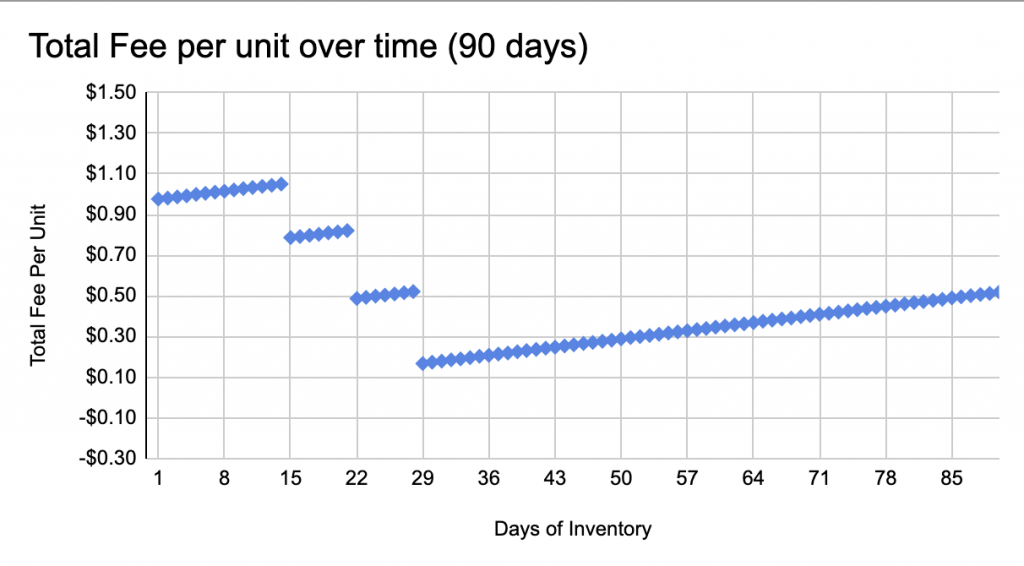
Example 5b: (After Q4) …to a 29-49-day range for the same example product.
Low Inventory Fee: So what is your game plan?
Let’s go back to the 5 conundrums.
- IPI: Probably don’t stock the max days of every SKU as that can be unnecessary for to have 179 days of inventory. However, find that optimal range for your products by stocking as little as you can, never dipping below 35 days of stock. Yes, 35, not 28 — the reason why is #2.
- 7-Day: Amazon is calculating most of these metrics on a 7-day cycle — not daily. This means if you are off by your estimates, you won’t know until every Monday. So plan to add a 7-day buffer to your “28-day minimum”.
- Product Tests + Seasonal: Product testing will likely require shortening your lead times by having stock on hand to ship to Amazon quickly to be able to react to the market. But the cost of testing a SKU might be inclusive of some of this fee moving forward. For Seasonal products, AWD may be an option for some, it will be better to either “price in” the fee or send in stock as early as possible. So if your product size tier allows for an optimal 29-130 days of stock, sending in the product, 120 days before the holiday may be a better move. Additionally, you may want to stay in stock slightly after a holiday, so adjust accordingly. The reason why this works is that you will leverage the 90-day historical calculation to “hold the weight of averages” (Being grossly overstocked early on balances out running out of stock toward the end) even though the 30-day as you run out of stock will be too low.
- Parent ASINs: This is extremely powerful, but can be used for or against you. This means that if you have products running into serious stocking out issues, putting them in a slower-moving parentage can “buy” you some time. The opposite is also true. If a product is “dragging down” an entire parentage, you don’t want to pay the Low Inventory Fee for every single variation. It may be wise to remove the ASIN from that parentage so the others aren’t negatively impacted.
- Stock Optimal Quantities: Of course optimizing your lead times, analytics for forecasting, and shortening your check-in times at Amazon are always helpful. But for absolutely free you can have access to the Low Inventory Fee calculator I designed!
I hope this helps you plan for the new Low Inventory Fee. In return, all I ask is to please share this with your industry connections. Additionally, if your business is looking for FBA Prep, DTC Fulfillment, Logistics/Supply Chain Support, or other related needs, please feel free to reach out at the Contact Form Here!
Sources:
- Low Inventory Fee Help Page
- Additional Clarification Post by Amazon
- Post regarding Data Visibility for Sellers
- Storage Fees
- Statistical Analysis and Research Study
Disclaimer: This tool is only an estimate and does not factor in all variables of a product. Please do supplemental research for your business needs. Minor discrepancies have been found with certain product sizes due to Amazon’s data turning into a limited piecewise function or multi-variable calculus.
Pingback: The Challenge of Amazon's New Fee - Seller Sessions Podcast
Just want to thank you for the detailed explanation and math models!
Thank you for breaking this down and sharing the model! Much appreciated!
This is the best explanation about LIF, thank you very much.
Pingback: Convoluted, Confusing, Byzantine… | Mission Fulfillment Plus
Pingback: Amazon Restock Limits are BACK in 2025 - Now What? - Marketplace Prep
Super helpful. Thank you!
Pingback: Product Variations from Search Results - FBA Lead List